All featuresFeature overview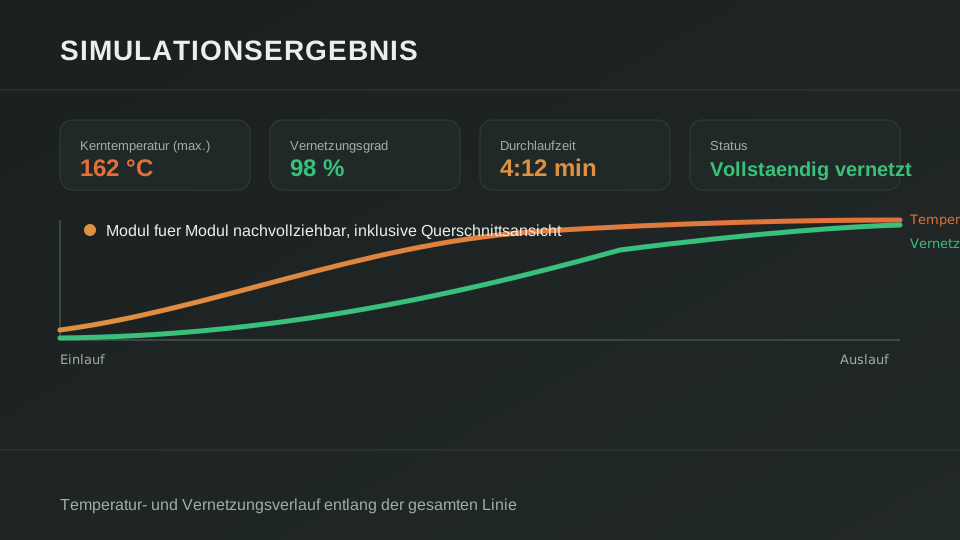
Simulation
The results dashboard shows temperature and cure progression at a glance, complemented by a cross-section view that lets you jump to any position along the line. Different versions of a simulation run – say, after changing speed or machine assignment – can be compared side by side.
Core temperaturePeak value across the entire run
Cure stateAt the exit of the final zone
Residence timeDepends on line length and speed
Per-module breakdownEvery zone traceable on its own